
Computational Pipeline
This work uses a uniform computational workflow to merge and process high-throughput RNA-sequencing (RNA-seq) data from a range of autoimmune diseases. This approach ensures uniformity, reduces technical variability and offers detailed insights into gene-level expression, as well as transcript-level usage (As shown in pipeline).
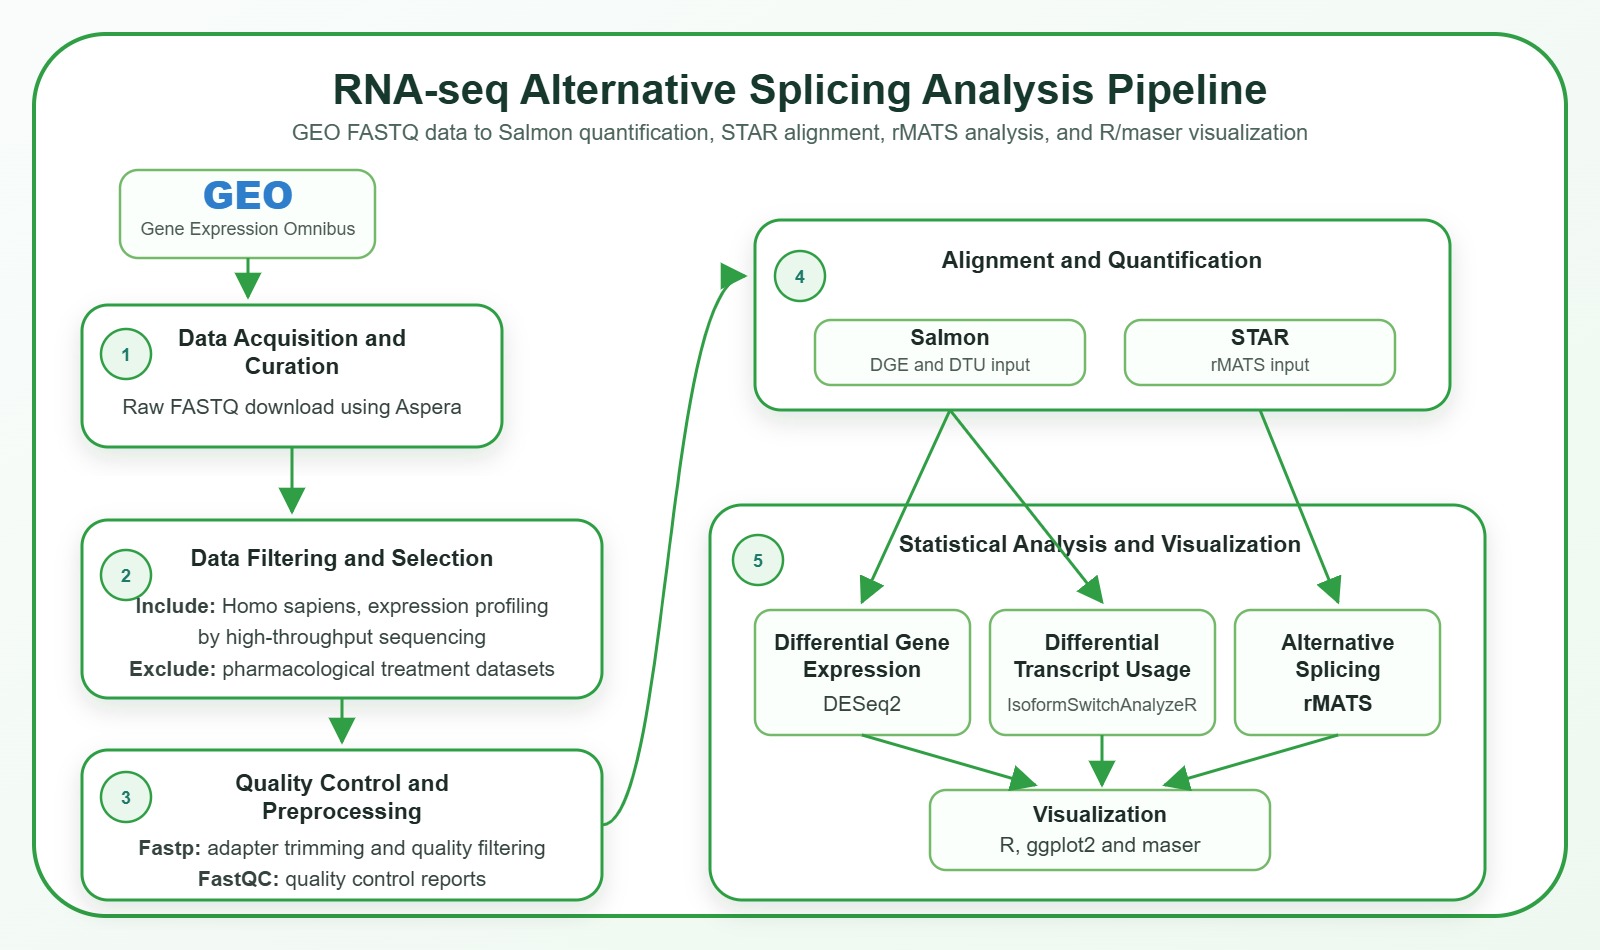
Data Acquisition and Curation
Quality Control and Preprocessing
Data Filtering and Selection Criteria
- Organism: Only studies utilizing samples from Homo sapiens were included.
- Modality: Data was restricted to Expression profiling by high-throughput sequencing.
- Sample Condition: To isolate the intrinsic molecular signature of the diseases, any samples subjected to pharmacological treatments (drugs or other chemical substances) were rejected. This prevents the confounding effects of therapeutic interventions on the transcriptome.
- Retrieval: Raw sequencing data (FASTQ files) were downloaded using the Aspera Command Line Interface to ensure high-speed, reliable transfer of large-scale genomic data.
Transcript Alignment and Quantification
We utilized Salmon v1.4.0 for alignment and quantification of transcript-level abundance which we used as an input for DESeq2 and IsoformSwitchAnalyzeR v2.8.0. Salmon was chosen because it employs a quasi-mapping algorithm that maps reads to transcript positions without the computational overhead of full base-to-base alignment. This approach is not only faster than traditional aligners but also demonstrates robustness to sequencing errors and genomic variations. The software utilizes a dual-phase parallel inference algorithm and sample-specific bias models to correct for fragment GC content and positional biases, which significantly improves the accuracy of downstream differential expression analysis.
Cleaned sequencing reads were aligned to the human reference genome (GRCh38.p14.genome.fa) using STAR v2.7.11b (Spliced Transcripts Alignment to a Reference) which is an RNA-seq aligner optimized for fast and accurate alignment of reads from transcriptomic sequencing. STAR was chosen because it uses an algorithm that maximizes mappability of the smaller seed, and then clusters and stitches together the larger seed to accurately detect exon-exon splice junctions. This way, it allows for efficient alignment of reads that cover splice-junctions without compromising on mapping speed and sensitivity. Moreover, STAR identifies annotated and novel splice junctions which is well suited for downstream alternative splicing analysis.
Alternative Splicing Analysis
For detection and quantification of alternative splicing events between disease and non-disease samples, we used rMATS (replicate Multivariate Analysis of Transcript Splicing). Prior to analysis, datasets with a read length ≥75 bp and sequencing depth ≥30 million reads were included to ensure robust splice junction detection. Significant splicing events were identified using an FDR cutoff of ≤0.05 and an ΔPSI (Delta PSI) cutoff of ≥0.1.
We selected rMATS because it is able to detect changes in exon inclusion levels while taking into account biological replicates and sample-to-sample variability. It has two calculation strategy: Junction Count (JC), which counts only junctional reads and Junction Count with Exon Count (JCEC) which counts both the junctional and exon reads helping in better estimation of exon inclusion. It can be used to identify the five major classes of alternative splicing events, namely Skipped Exon (SE), Alternative 5′ Splice Site (A5SS), Alternative 3′ Splice Site (A3SS), Mutually Exclusive Exons (MXE), and Retained Intron (RI).
Statistical Data Analysis and Visualization
Differential Gene Expression (DGE)
Gene-level differential expression was performed using DESeq2 v1.48.1. This package models raw counts using a negative binomial distribution to account for the over-dispersion inherent in RNA-seq data. It uses empirical Bayes shrinkage approach to stabilize the estimate for log-fold change and dispersion, which is more stable for genes with low counts or high variability. Differentially expressed genes were selected using a baseMean ≥10, an adjusted p-value (padj) ≤0.05, and log2 fold change (|L2FC|) ≥0.5.
Differential Transcript Usage (dTU)
For the analysis of differential transcript usage we used IsoformSwitchAnalyzeR. This tool identifies switches where the relative contribution of specific isoforms to total gene expression changes, even if the overall gene expression remains constant. This is critical for discovering the functional consequences of alternative splicing, such as the gain or loss of specific protein domains. For isoform switch analysis, the geneExpressionCutoff ≥2, was used and the isoformExpressionCutoff ≥0.1, the significance threshold (alpha) ≤0.05, the dIFcutoff to 0.1, and the isoform_switch_q_value cutoff of 0.05.
Visualization
All data visualizations, including volcano plots, heatmaps, and transcript usage plots, were generated using the ggplot2 v4.0.2 package. For rMATS visualization we used maser v1.28.0 (Mapping Alternative Splicing Events to pRoteins) tool. This provided a flexible and standardized framework for representing complex multi-condition transcriptomic patterns.
Help Guide
Use the collapsible sections below to find step-by-step instructions and screenshots for each website tool.
Mechanisms of Alternative Splicing Pre-mRNA → Mature mRNA isoforms
Five canonical event types typically capture all the variations seen genome wide: Exon Skipping or Skipped Exon (SE), alternative 5′ or 3′ splice site usage (A5SS and A3SS respectively), Intron Retention (RI), and Mutually Exclusive Exons (MXE). These events cause proteomic diversity and tissue specific gene expressions. However, any dysregulation or loss of control in these events results in imbalanced homeostasis and subsequently disease such as Cancer and Autoimmune Disorder as explored in this database.
All introns are removed and all exons are joined, it produces a single, invariant mRNA transcript.